If a Picture is Worth a Thousand Words, Why Do We Use Words in Education?

“A true photograph need not be explained, nor can it be contained in words.”
Ansel Adams

A picture is worth a thousand words. As someone who has practiced the art of photography for most of his life, this phrase has always rung true.  The phrase seems to have had its origin in US advertising in the early 20th center. (The Phrase Finder, retrieved June 25, 2019, from https://www.phrases.org.uk/meanings/a-picture-is-worth-a-thousand-words.html) While it is certainly possible to learn without images, ask the 63,357 K-12 blind students in the US, (National Federation of the Blind, Blindness Statistics, retrieved June 25, 2019, from https://nfb.org/resources/blindness-statistics) image use is quite prevalent in education.

I don’t know many biology teachers that teach the structure of a eukaryotic cell without using a picture like the following one.

Unannotated version of File:Animal_Cell.svg, Author Kelvin Song, https://commons.wikimedia.org/wiki/File:Animal_Cell.svg. This file is made available under the Creative Commons CC0 1.0 Universal Public Domain Dedication.

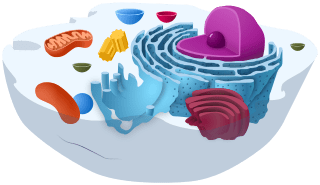
Not only does this diagram display the components of a cell, but it also helps to establish a relationship between the different parts of the cell. In the textbook Concepts of Biology, the introduction to the structure-function of eukaryotic cells is 14 pages long.  There are 16 images and 4486 words on 14 pages.  That works out to about 320 words and one image per page.

The ratio of text to images in textbooks changes as students’ progress from kindergarten to college. The structure of the college textbook is different from primary school readers.  For example, in the Jack and Jill or Little Dog Spot readers, the whole page is a picture with a maybe seven words (Jack and Jill went up the hill).  While I don’t think a cell biology textbook written like a Jack and Jill book would be a good idea.  Can you imagine how long a college textbook would be if each page were a full-page image with a single sentence like, “eukaryotic cells contain a membrane-bound nucleus?”

While textbooks composed primarily of images will probably not work, I do wonder if we make proper use of images in textbooks.  One of the most common complaints, besides cost, I hear from students is that textbooks are boring, too long, and hard to read.  While the central point of a textbook should be as a teaching tool not merely as a download of facts, we also need to remember that learning to extract information from text is essential.  There are times when books of exclusively just text are necessary, even essential. I don’t see my Shakespearean literature class having worked without reading the plays. That said I do wonder if textbooks should not only include more images but use the images as a central teaching tool rather than just support for text after all image use is a core part of our mental processes.

Images have been with us for longer than written language.  Some of the earliest examples of human-created images are cave paintings, like the paintings found in the Leang Timpuseng cave on the island of Sulawesi, Indonesia.  Scientists have dated the paintings in this cave to at least 35,400 years old.  While they are not as well-known as the paintings in France’s Chauvet Caves, they are older than Chauvet (32,000 – 28,000 years old) making them possibly the earliest cave painting in the world.

Written language was developed around 5200 years ago in the form of the cuneiform script by the Mesopotamians.  The cuneiform script has a direct linkage to images carved in small clay tablets.  The earliest writing was to take these clay tablets and press them into a sheet of clay, “recording the image.”  These images evolved into the symbols of the cuneiform script. In addition to the fact that humans have been using imagery for 10s of thousands of years longer than written language, there is also evidence that images are more effective for learning than text.

One of the ideas behind images being better learning aids, then the text is the theory of dual-coding.  Simply the theory of dual-coding is that images activate two memory centers.  A text-based system and a separate image-based system.  While text by itself only activates a text-based system.  It is also possible that this dual-coding system would work with the other senses, touch, smell, and taste. In education, dual-coding gives the learner twice the number of memory locations for recall.

Beyond cognitive mechanisms like dual-coding, there is also the idea of visual langue. “Visual language is defined as the tight integration of words and visual elements and as having characteristics that distinguish it from natural languages as a separate communication tool as well as a distinctive subject of research.” (Visual Language and Converging Technologies in the Next 10-15 Years (and Beyond)) Infographics are an example of visual language.  Additionally, the paper Visual Language and Converging Technologies in the Next 10-15 Years (and Beyond), says that visual communication increases information transfer. “For example, improvements in human performance from 23 to 89% have been obtained by using integrated visual-verbal “stand-alone” diagrams.”

The ideas of dual-coding, coupled with visual language, suggest that textbooks should include more images.  Additionally, these images should be integrated tightly with the text and viewed as a central component of the learning process. Authors should not consider Images as secondary to the text but as an essential learning component on their own.

However, like so many other aspects of educational research while there is research stating that textbooks are not useful learning tools.  It is not clear if this failure is because textbooks are inherently ineffective learning tools or because of factors other than learning drive textbook design.  As I have said repeatedly, we desperately need more research into what makes an effective textbook.  In the meantime, maybe we should add a couple of pictures.

Thanks for Listing to my Musings
The Teaching Cyborg

Blame the Tools, It’s Easier

“PowerPoint is the Rodney Dangerfield of software. It gets no respect.”
Ken Goldberg

Universities should ban PowerPoint. It makes students stupid and professors boring.” That is the title of an article from the Business Insider that recently came up in my LinkedIn feed.  While I generally agree with the author’s statement that schools usually measure student satisfaction instead of student learning.  I do take exception to the idea that PowerPoint is the root of all evil.  The core of the author’s argument seems to be that lectures are generally not effective learning tools.  Again, I generally agree with the idea that lectures are not effective.  However, the author seems to blame PowerPoint for the persistence of lectures in education.

To quote the author, “Overreliance on slides has contributed to the absurd belief that expecting and requiring students to read books, attend classes, take notes, and do homework is unreasonable.”  I, however, find this statement a little strange.  For starters in almost all college-level courses, students don’t read in class.  Students are expected to do their reading, textbook, novel, manuscript, and articles, either as preparation for class or review after class.  How does the use of PowerPoint in class effect students reading out of class? 

While I expect students being bored with poor lecturers could lead to decreases in attendance.  I suspect attendance has more to do with faculty policy then the technology used in the classroom.  In many undergraduate course’s faculty say it is up to the students to determine if they are going to attend or not.  They often call it “treating them like adults.”  If you think attendance is essential, require it, and then make the class time worthwhile, don’t blame random tech.

Homework, just like reading, is done outside of class.  Of all the complaints, the only one that might be valid is note taking. After all, how the instructor presents the material will affect the student’s ability to take notes.  However, is this the fault of the program or the failure of the presenter.

 Whenever people start blaming educational problems exclusively on technology, I remember a quote I heard years ago. “The students got distracted by Facebook, so we took away the Internet. The students got distracted playing Solitaire, so we took away their computers, the students got distracted doodling, so we took away their pencils.”  -Anonymous. This quote always reminds me of how easy it is to blame other things when the individual ultimately responsible for the classroom is the teacher.

So is the presentation tool PowerPoint responsible for poor classroom engagement and bad lectures or is the real problem that individuals don’t learn how to use PowerPoint.  Let’s start with the basics, suppose I’m teaching An Introduction to Circuits course. First, we need to create a new slide presentation, and PowerPoint gives us lots of choices.  Never use just a plain white background. With a white background; you can get chromatic aberration; the projector produces rainbows on the screen.  The critical thing to remember is, I don’t want anything showing up on my slides that I don’t put there.

Look at the three slides below they are all available in PowerPoint which slide do you think would be the best.

Three PowerPoint Title slides with Title An Introduction to Circuits and subtitle CH1-Voltage. Slide A has a pretty but busy background and white text in a black box. Slide B has a light blue background with a dark gradient toward the bottom right corner and a circuit pattern along the left edge. The text is white. Slide C has a light blue background with white text.

How many of you choose C as the best option?  Slide A is to use an old saying too busy.  The circuit drawings on the side of B might be a distraction.  The color gradient is not that bad an idea? We read slides from left to right and top to bottom a color gradient that uses the same pattern can help direct the eyes across the slide. However, you will have to keep this directionality in mind with everything you put on the slide. That leaves slide C, which is honestly not great.  Modern projectors are bright, light text on a light background is hard to read.  Creating an excellent presentation is all about fighting the defaults. So instead of light text use dark text, this gives us the slide below.

A PowerPoint title slide with a light blue background and black text

The next point concerning text is readability.  The most significant impact on readability is room size.  The larger the room, the bigger the text needs to be on the screen.  Dave Paradi wrote a great article on text size for presentations Selecting the correct font size.  Using Paradi’s work using a 10’ screen in a classroom where the furthest student is ~45’ away (100 student lecture hall) the smallest usable font size is 24 point.  In a 500-student lecture hall (most distant student ~150’ away) the smallest usable font is 44 point.  See the slides below.

Two PowerPoint title slides The two slide the first uses 24 Point text as the smallest and is for viewing form a maximum of 45 ft the second uses 44 point text as the smallest and is for viewing from a maximum of 150 ft.

That is a significant change in the appearance of the slides for a difference of about 100’.

Beyond text size and color, the most common complaint I hear is that PowerPoint forces you to use bullets.  However, you can change bullets. You can turn them off, or not use them.  Textboxes and other slide layouts mean you can place text anywhere you want.  Remember an excellent PowerPoint presentation requires you to fight the defaults.

Now let’s be honest while I believe most if not all the problems with PowerPoint presentation are because of a lack of training the solution is not easy.  After all, I only covered the basics of background and font size in a PowerPoint presentation.  There are also issues concerning images, slide layouts, and presentation lengths to discuss.  It is also possible to add questions to use with student response systems. Lastly, instructors can use PowerPoint presentations for active engagement. Maybe I should write a few more posts on this topic?

Thanks for Listing to My Musings
The Teaching Cyborg

In Research We Trust

“Facts are stubborn things, but statistics are pliable.”
Mark Twain

Anyone that knows me knows I believe in research and data backed decisions in education.  Successful research is a balancing act between skepticism and an openness to new sometimes radical ideas.  To avoid the possibility of bias, we have developed methodologies and techniques to determine the validity of an experiment.  Experimental validity falls into two categories: internal, experimental design, data collection, and data analysis. The second is external, the progression from hypothesis to theory, and finally to the fact.  Research drives the progression from hypothesis to fact with supporting evidence and replication.

Considering how vital replication is to research, there appears to be very little direct replication.  Makel and Plucker showed that only 0.13% of educational research is replicated (Facts Are More Important Than Novelty: Replication in the Education Sciences).  Compared to a rate of 1.07% in psychology and 1.2% for marketing research.  However, the rate of replication does not tell the whole story.  After all, to publish research, you need to conduct an experiment, submit it for peer review, make changes, and then have your article published.  Perhaps we can accept published results.

Looking at actual replication studies suggests that publication is not enough.  One study in psychology, Estimating the reproducibility of psychological science, was only able to replicate 63% of the studies they examined.  Replications of clinical research are even worse.  A group from Amgen attempted to replicate 53 research studies in cancer research they only replicated 6 of them.  Additionally, a group with Bayer Health could only replicate 25% of the preclinical studies they tested (Drug development: Raise standards for preclinical cancer research). 

So how do we resolve the replication crisis?  We need to reproduce previous research and publish the results.  The problem is that professors, postdocs, and graduate students don’t benefit from replication studies.  Even if researchers get the articles published, they don’t carry the same weight as original research.  One possibility would be to have graduate students replicate experiments at the beginning of their graduate study as part of their training.  However, this is probably not a workable solution as it would likely lengthen the time to degree. 

So, who would benefit from reproducing research?  The answer is undergraduates.  Conducting replication studies would more effectively train students in research methodologies than any amount of reading.  Why would conducting replication studies help students with research design?  The reason is that if you replicate a study perfectly (exactly as undertaken previously), you might have the same problems the original researchers had.  After all, most of the issues in research are not intentional but unintentional and probably unidentifiable problems with data collection or analysis.

Statistical analysis of most data involves a null hypothesis.  When the data is analyzed, the null hypothesis is either accepted or rejected.  Errors analyzing a null hypothesis, are classified as Type I (rejecting a correct null hypothesis) or Type II (accepting a false null hypothesis).  The critical thing to keep in mind is that it is impossible to eliminate Type I and II errors.  Why can’t researchers eliminate Type I and II errors? Think about a P value, P < 0.001, what does the number mean.  Written in sentence form as P value < 0.001 means: the likely hood that these results are the product of random chance is less than 1 in 1000.  While this is a small number, it is not zero, so there is still a tiny chance that the results are due to random chance. Since P values never become P < 0, there is always a chance (sometimes ridiculously small) that results are due to random chance.

In addition to Type I and II errors, there could be problems with sample selection or size. Especially early in the research were influencing and masking factors might not be known.  Alternatively, limited availability of subjects could lead to sample size or selection bias.  All these factors mean that a useful replication study looks at the same hypothesis and null hypotheses but uses similar but not identical research methods.

Beyond the benefits students would gain in experimental design, they would also learn from hands-on research something that many groups say is important for proper education.  Additionally, replication research is not limited to biology, chemistry, and physics.  Any field that publishes research (i.e., most areas of study) can take part in undergraduate replication research.

Of course, these replication studies will only benefit research if they are published.  We need journals to publish replication studies, how do we do that.  Should a portion of all journals be devoted to replication studies?  The Journal Nature says it wants to publish replication studies; “We welcome, and will be glad to help disseminate, results that explore the validity of key publications, including our own.” (Go forth and replicate!).  Hay Nature how about really getting behind replication studies! How about adding a new Journal to your stable, Nature: Replication?

However, if we want to disseminate undergraduate replication studies, it may be necessary to create a new Journal, The Journal of Replication Studies?  With all the tools for web publishing and e-Magazines, it should be straight forward (I didn’t say free or cheap) to create a fully online peer-reviewed journal devoted to replication.  Like so many issues, the replication crisis is not a problem but an opportunity.  Investing in a framework that allows undergraduate to conduct and publish replication research will help everyone.

Thanks for Listing to My Musings
The Teaching Cyborg

Common Core Math Does it Work?

“Do not worry about your difficulties in Mathematics. I can assure you mine are still greater.”
Albert Einstein

A friend of mine sent me a YouTube video comparing common core math with “old math.”

My first thought was this is the dumbest thing I have ever seen. Now let’s be clear my reaction was not because the old math was so much faster. After all, the person doing the old math is merely solving an equation. The teacher is instructing the students in a common core mathematics process which takes longer. So it was not the length, it seems to me that the process is complicated, off track, and fails in several cognitive theories.

However, I believe in letting the research speak for itself, which means double checking your opinions with the literature. Most of my work is at the college and university level with a focus on STEM education. So what effect has the common core had on college students, primarily STEM students?

Before we look at the effect of the common core standards lets review what the common core is. The common core standers are a guideline of what students should learn each year of K-12 education. The standards are meant to be rigorous and meet the need of colleges and employers. According to the criteria for the working group, each standard should have:

“Goal: The standards as a whole must be essential, rigorous, clear, and specific, coherent, and internationally bench marked.

Essential: The standards must be reasonable in scope in defining the knowledge, and skills students should have to be ready to succeed in entry-level, credit-bearing, academic college courses, and in workforce training programs.”

The publishing of the full common core standards was in 2010. As of 2017, 46 states have adopted the common core standard to some degree. Eleven of the states have announced they are undertaking rewrites and changes to the standards.

Even with 11 states announcing rewrites or changes, this is still a high adoption rate. The adoption rate does not tell the whole picture. In K-12 education a lot is left up to the local school districts. While states have adopted the standards, it is not clear how consistent implementation is. It will likely get even harder to study the common core standards, as many states are renaming and modifying the standards. Many of these changes may be cosmetic as Tom Loveless says:

“A lot of states have simply re-branded the standards, changing the name or slightly tinkering with them without making any great change in substance” Loveless says. “That to me suggests that it’s more a political response than anything else.” (Common Core no more? New York and 21 other states revise or rename K12 standards, District Administration, By Alison DeNisco | October 9, 2017, retrieved June 6, 2019, from https://districtadministration.com/common-core-no-more-new-york-and-21-other-states-revise-or-rename-k12-standards/)

How do teachers view the standards? According to a report by the Center for Educational policy: “Across the five focus groups, most elementary school teachers expressed positive views of the Common Core State Standards. … Teachers said the Common Core had changed instruction in positive ways, such as teaching for conceptual understanding and developing students’ thinking and problem-solving skills.” (Listening to and Learning from Teachers: A Summary of Focus Groups on the Common Core and Assessments Key Findings and Policy Recommendations, Center on Education Policy, By Diane Stark Rentner, Nancy Kober, Mathew Frizzell, and Maria Ferguson, October 12, 2016, Retrieved June 6, 2019, from https://www.cep-dc.org/cfcontent_file.cfm?Attachment=RentnerKoberFrizzellFerguson%5FSummary%5FListenLearnTeachers%5F10%2E12%2E16%2Epdf)

So why don’t I like the method of mathematics presented in the video? Let’s look at the steps the students are being asked to do when answering, 35 x 12. In the first step the students break the numbers down into their components 35 = 30 + 5 while 12 = 10 +2. Students then plug the numbers into a grid and multiplication is done by multiply the rows by the columns. The multiplication produces four numbers which are added to get the final answer.

I have heard several arguments about why this method is better. First, it teaches students how to manipulate numbers. Second, by breaking the numbers apart, it is easier for students to remember and do the math in their head. The grid is a rectangle some instructors use area equations to represent the multiplication, height x width = area. By using this representation, students get a feel for the real size of numbers.

While I agree learning to manipulate numbers is essential for students, I am not sure this method teaches students that. I think it is more likely that students are viewing this as a trick or formula. We know from research that students are good at plugging numbers into formulas without understanding what they mean. Just look up the original research on the Force Concept Inventory Test.

The idea that this method makes it easier to do in your head sounds intuitively correct. However, it might fall short of our research on how memory works. Again we know that working memory has a capacity limit (I wrote about it here).

So when multiplying 35 x 12 in your head, you have to remember two numbers. When you separate the numbers, you need to remember four numbers; 30, 5, 10, & 2. Additionally, as I do the math, I need to remember more numbers 30 * 10 = 300. I need to remember; 30, 5, 10, 2, & 300 additionally, I need to remember that 300 is different than the other four. Using this method, it is more likely that a student will run out of working memory.

Lastly, I have two problems with using the grid to represent the actual size of the number. There is a counter argument of numerals being symbols so we can deal with numbers that we can’t intuitively grasp. However, that is not the biggest problem; the real issue is transference. Transference is the ability of students to take the information they learned and use it in new situations. If students get to fixated on numbers representing fiscal shapes and physical quontites, they may have trouble with things that are difficult to see or understand.

So what does the research say about college students that were taught using the Common Core standards during their K-12 years? According to a 2016 study, there is disagreement about what math standards college students need. “Mathematics finding 4 indicates that although middle school and high school teachers generally agree about what mathematics skills are important to success in STEM courses and careers, college instructors or workforce respondents ascribed much less importance to those skills.” (ACT National Curriculum Survey 2016, ACT, Inc, retrieved June 6, 2019, from http://www.act.org/content/act/en/research/reports/act-publications/national-curriculum-survey.html ) At least part of this discrepancy comes from colleges and universities have different views and requirements. The 2015 Brown Center Report on American Education (https://www.brookings.edu/research/2015-brown-center-report-on-american-education-how-well-are-american-students-learning/) shows small gains in student performance in states that fully implemented the common core standards. Unfortunately, these difference are below or borderline concerning statistical significance.

Sadly it appears there is not a lot of research, at least yet, on the common core standards. What research exists seems to be leaning in the direction of the standards not living up to its goal. Whether this is the results of implementation or the standards themselves, it is not clear. For the time being, I will have to live with my dislike while trying to keep an open mind. What is defiantly clear is that more research, mainly that focused on learning gains, is desperately needed. Also, colleges and universities frantically need to work with K-12 so that everyone knows what is the need and expected of students perusing higher education.

Thanks for Listing to my Mussing
The Teaching Cyborg